 News
June 27, 2023 © Copyright Newage
News
June 27, 2023 © Copyright NewageIntroduction
In the ever-evolving digital landscape, data is being generated at an astonishing rate, continuously fueling the need for effective data analytics. Excel, a powerful tool plays a pivotal role in this pursuit by enabling professionals to dive deep into large datasets, extract valuable insights, and facilitate data-driven decision-making processes.
In today’s world, businesses thrive on informed decisions, data analysis takes centre stage. And there’s no better tool than Excel to dive deep into your data, unravel its hidden secrets, and gain a competitive edge. With its user-friendly interface and robust features, Excel allows you to effortlessly navigate through vast datasets, deciphering meaningful insights that drive your business forward.
With its intuitive interface, Excel empowers you to effortlessly enter values, perform calculations, and unleash the power of functions. From basic arithmetic operations to complex data analysis, Excel has it all. Pivot tables, pie charts, and graphing tools bring your data to life, making it easier to spot trends and patterns.
But Excel doesn’t stop there. It goes beyond traditional spreadsheet functionalities with Visual Basic for Applications (VBA), a programming language that allows you to automate tasks and create custom solutions tailored to your needs.
Excel formulas are important because they allow businesses to easily analyze data. Here are some benefits:
5 Essential Excel Features For Data Analysts
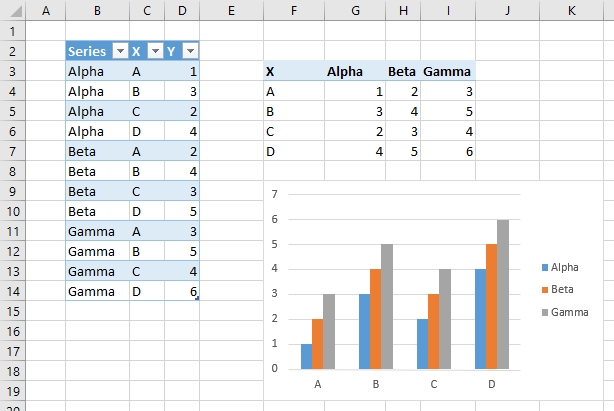
Pivot charts serve as a visual representation of the information presented in a pivot table, offering a quick and insightful overview. Pivot tables provide a convenient method for restructuring columns and rows, and converting them into groups, statistics, or summaries. By utilizing the PivotChart feature found under the Insert menu, we can generate a chart alongside the table, enhancing our data analysis capabilities.
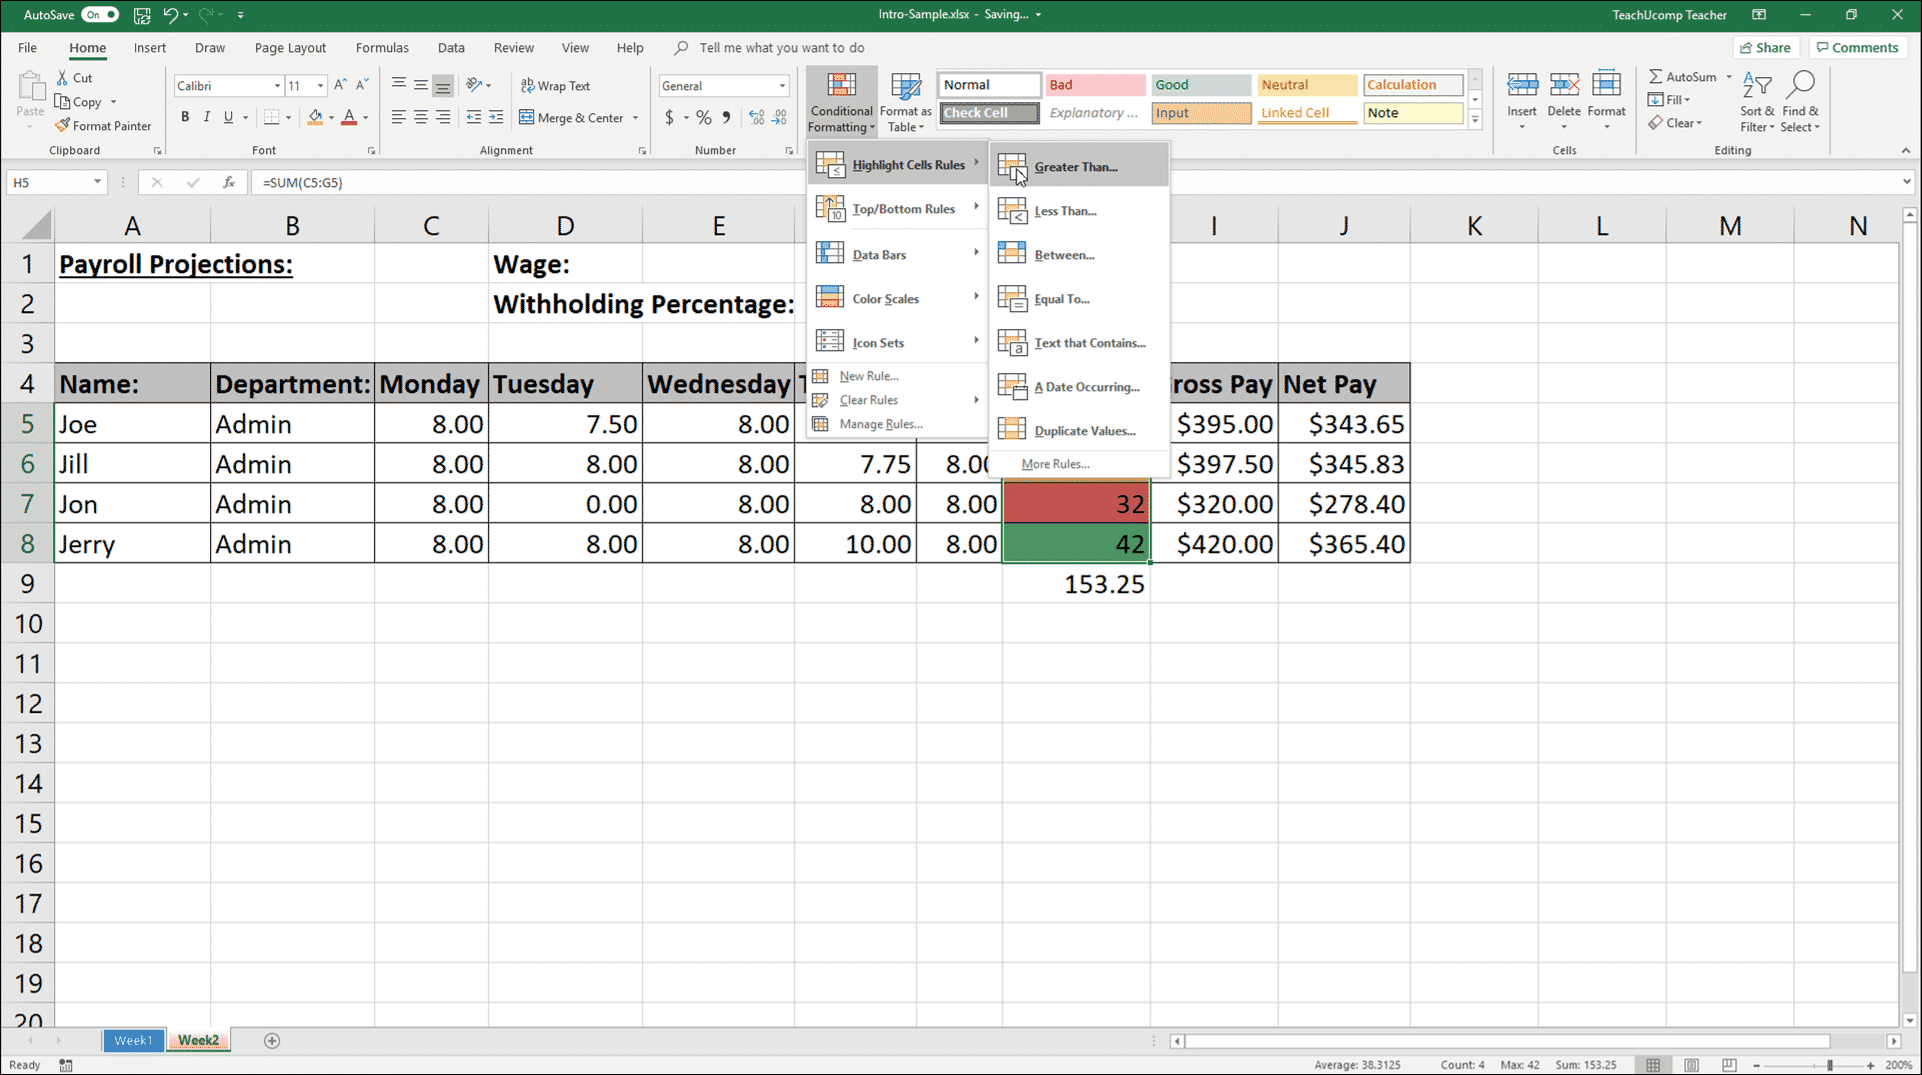
By utilizing conditional formatting, you have the ability to emphasize or conceal cells based on specific criteria that you define. This feature can be applied to individual cells or multiple cells within the same worksheet. Conditional formatting proves to be beneficial when identifying outliers, duplicates, or patterns within your data.
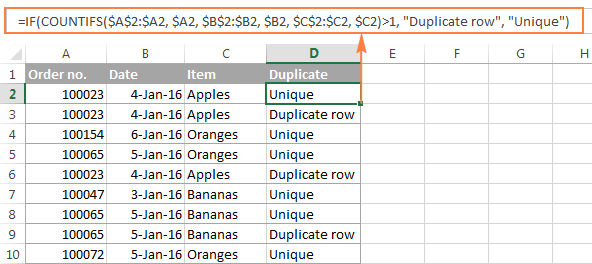
Given the frequent occurrence of messy data, possessing the knowledge to eliminate duplicates becomes crucial. By applying conditional formatting rules, you can easily highlight duplicate entries for review before proceeding with their deletion. To access the Remove Duplicates feature, navigate to Data > Data Tools > Remove Duplicates

XLOOKUP combines the functionalities of VLOOKUP and HLOOKUP, enabling you to search for a value within a range both vertically and horizontally. It offers the flexibility to use a designated range as a lookup table, retrieving the desired result and populating it into a designated cell.
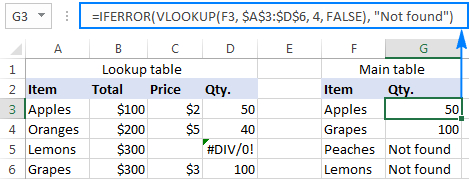
The IFERROR function proves to be an invaluable tool when dealing with formula errors, as it enables the creation of customized error messages. By utilizing this function, you can effectively wrap your formulas, such as XLOOKUP, and specify a clear and informative message to be displayed in case of an error. The syntax for IFERROR is relatively straightforward and can be implemented as follows:
=IFERROR(value, value_if_error)
Data Visualization in Excel
Mastering the art of visualising data in Excel is a valuable skill when working with spreadsheets. With various techniques at your disposal, you can bring your data to life and convey compelling narratives.
One popular method is through the use of charts and graphs. Excel offers a wide range of options, including line graphs, bar graphs, pie charts, and scatter plots. To create a chart or graph, simply select the data you want to visualize, navigate to the “Insert” tab, and choose the desired chart type from the dropdown menu. Tailor the chart to suit your needs and reveal meaningful patterns.
Conditional formatting provides another avenue for data visualization. By assigning specific criteria, you can instantly identify patterns and trends within your spreadsheet. Whether it’s highlighting cells based on values, colour gradients, or data bars, conditional formatting offers a quick and intuitive way to uncover valuable insights.
Excel’s powerful data visualization capabilities empower you to transform raw data into impactful visual stories. Sharpen your skills and unlock the true potential of your data.
Conclusion
In the corporate landscape, Microsoft Excel reigns supreme as the go-to software. Its widespread adoption spans diverse professions, from banking and accounting to business analysis, marketing, scientific research, and entrepreneurship. The ubiquity of Excel in the workplace makes mastering it a valuable asset. Acquiring proficiency in Excel not only enhances your productivity but also sets you apart from the competition. Including an Excel skill set on your resume showcases your versatility and positions you as a valuable asset in the job market.
The Advanced Data Analysis Techniques Using Excel course offered by Newage Learning empowers professionals to leverage Excel’s powerful features for effective data analysis. By mastering advanced Excel tools, participants can unlock valuable insights, streamline processes, and make informed decisions. Enrol now with Newage Learning and take your data analysis capabilities to new heights!

The information contained in this website is for general information purposes only. The information is provided by Vivacoder Education LLC and while we endeavour to keep the information up to date and correct, we make no representations or warranties of any kind, express or implied, about the completeness, accuracy, reliability, suitability or availability with respect to the website or the information, products, services, or related graphics contained on the website for any purpose. Any reliance you place on such information is therefore strictly at your own risk.
 +971-52-263-0921
 +971-52-263-0921
 28 Jul 2023


 Dubai Technology Entrepreneur Campus (DTEC) Dubai Silicon Oasis, UAE
  +971-52-263-0921